2025 Oil Production Forecast: Corrected Figures for Middle East and North Africa
The Bloomberg infographic on oil production for 2025 contained significant inaccuracies, particularly for Algeria and Saudi Arabia. Corrected projections from the U.S. EIA reveal Algeria at 1.38 mb/d and Saudi Arabia at 10.68 mb/d, highlighting challenges in Algeria's energy sector. Accurate data is vital for effective market and policy planning.
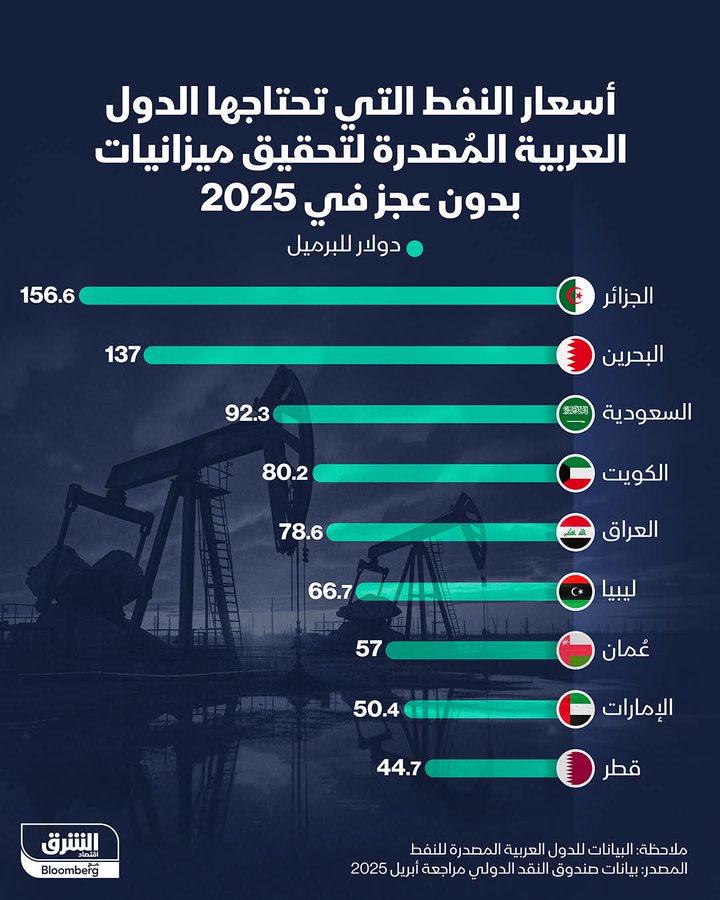
A recent Bloomberg infographic titled "Expected Oil Production for Regional Countries in 2025" contained significant errors, reporting unrealistic figures like 156.6 million barrels per day (mb/d) for Algeria and 92.3 mb/d for Saudi Arabia. Using reliable data from the U.S. Energy Information Administration (EIA) and industry sources, this article provides accurate 2025 oil production forecasts for key regional producers, including Algeria, Saudi Arabia, UAE, and others, while addressing challenges like Algeria’s energy sector planning.
Corrected Oil Production Forecasts for 2025
The EIA’s Short-Term Energy Outlook (April 2025) offers credible projections for oil production in million barrels per day (mb/d). Below is a table summarizing the expected output for 2025:
Country
Production (mb/d)
Notes
Algeria
1.38
Stable Q1 2025 output, despite aging infrastructure
Bahrain
~0.2
Estimated from 2023 data (0.183 mb/d)
Saudi Arabia
10.68
Q1 2025 data; potential increase by year-end
Kuwait
2.75
Based on Q1 2025 data
Iraq
4.41
Based on Q1 2025 data
UAE
4.18
Based on Q1 2025 data
Oman
1.02
2025 annual average (Non-OPEC)
Qatar
1.88
2025 annual average (Non-OPEC)
Iran
4.76
Based on Q1 2025 data
Why the Infographic Was Wrong
The Bloomberg infographic’s figures, such as 156.6 mb/d for Algeria, are implausible given that global oil production hovers around 100 mb/d. These errors likely stem from:
- Unit Misinterpretation: The figures may have confused million barrels per day (mb/d) with thousand barrels per day (kb/d). For instance, 156.6 kb/d equals 0.1566 mb/d, still far below Algeria’s actual 1.38 mb/d.
- Annual vs. Daily Output: If meant as annual totals, 156.6 million barrels per year for Algeria equates to ~0.43 mb/d, still inaccurate.
- Typographical Errors: The exaggerated totals suggest a possible data entry mistake.
The infographic’s implied total of over 600 mb/d vastly exceeds global demand, confirming its inaccuracy.
Algeria’s Oil Production: Planning Challenges
Algeria’s projected output of 1.38 mb/d in 2025 remains stable, but concerns about its energy sector persist. Aging oil fields, limited new discoveries, and insufficient investment hinder growth. Political instability and heavy reliance on oil exports without robust diversification strategies further complicate long-term planning. Despite these issues, Algeria maintains steady production, supported by existing infrastructure.
Regional Insights and OPEC+ Influence
Saudi Arabia: With 10.68 mb/d in Q1 2025, Saudi Arabia plans to boost output by 1 mb/d by December, per OPEC+ agreements, potentially raising its annual average.
OPEC+ Policies: A modest 411 kb/d increase in May 2025 reflects cautious production hikes, far below the infographic’s exaggerated claims.
Other Producers: UAE (4.18 mb/d), Iraq (4.41 mb/d), and Iran (4.76 mb/d) maintain significant output, while smaller producers like Oman (1.02 mb/d) and Qatar (1.88 mb/d) contribute steadily.
Global Context and Implications
Accurate forecasts are critical for energy markets and policy planning. The corrected figures align with global production capacity and demand, unlike the infographic’s flawed data. Stakeholders should rely on EIA and similar sources to inform decisions, especially as OPEC+ navigates supply adjustments amid fluctuating global demand.
Conclusion
The Bloomberg infographic’s erroneous figures misrepresented 2025 oil production for key regional countries. Corrected data from the EIA shows realistic outputs, with Saudi Arabia leading at 10.68 mb/d and Algeria holding steady at 1.38 mb/d despite planning challenges. As the energy landscape evolves, accurate data remains essential for understanding market dynamics.
Sources: U.S. Energy Information Administration (EIA), OPEC, CEIC Data